


Streaming giants Disney Co DIS, Netflix Inc NFLX and Roku Inc ROKU are in constant competition to dominate the screens of viewers worldwide. Traders and investors may prefer the companies for different reasons: Netflix as a pure streaming play; Roku hosts a variety of different streaming services including Netflix on its set-top box; or Disney, which offers diversity through its streaming, cruises, amusement parks and retail footprints.
All three stocks have settled into patterns that could give both bulls and bears a way to play.
See Also: 'Trading Nation' Traders Weigh In On Netflix And Disney
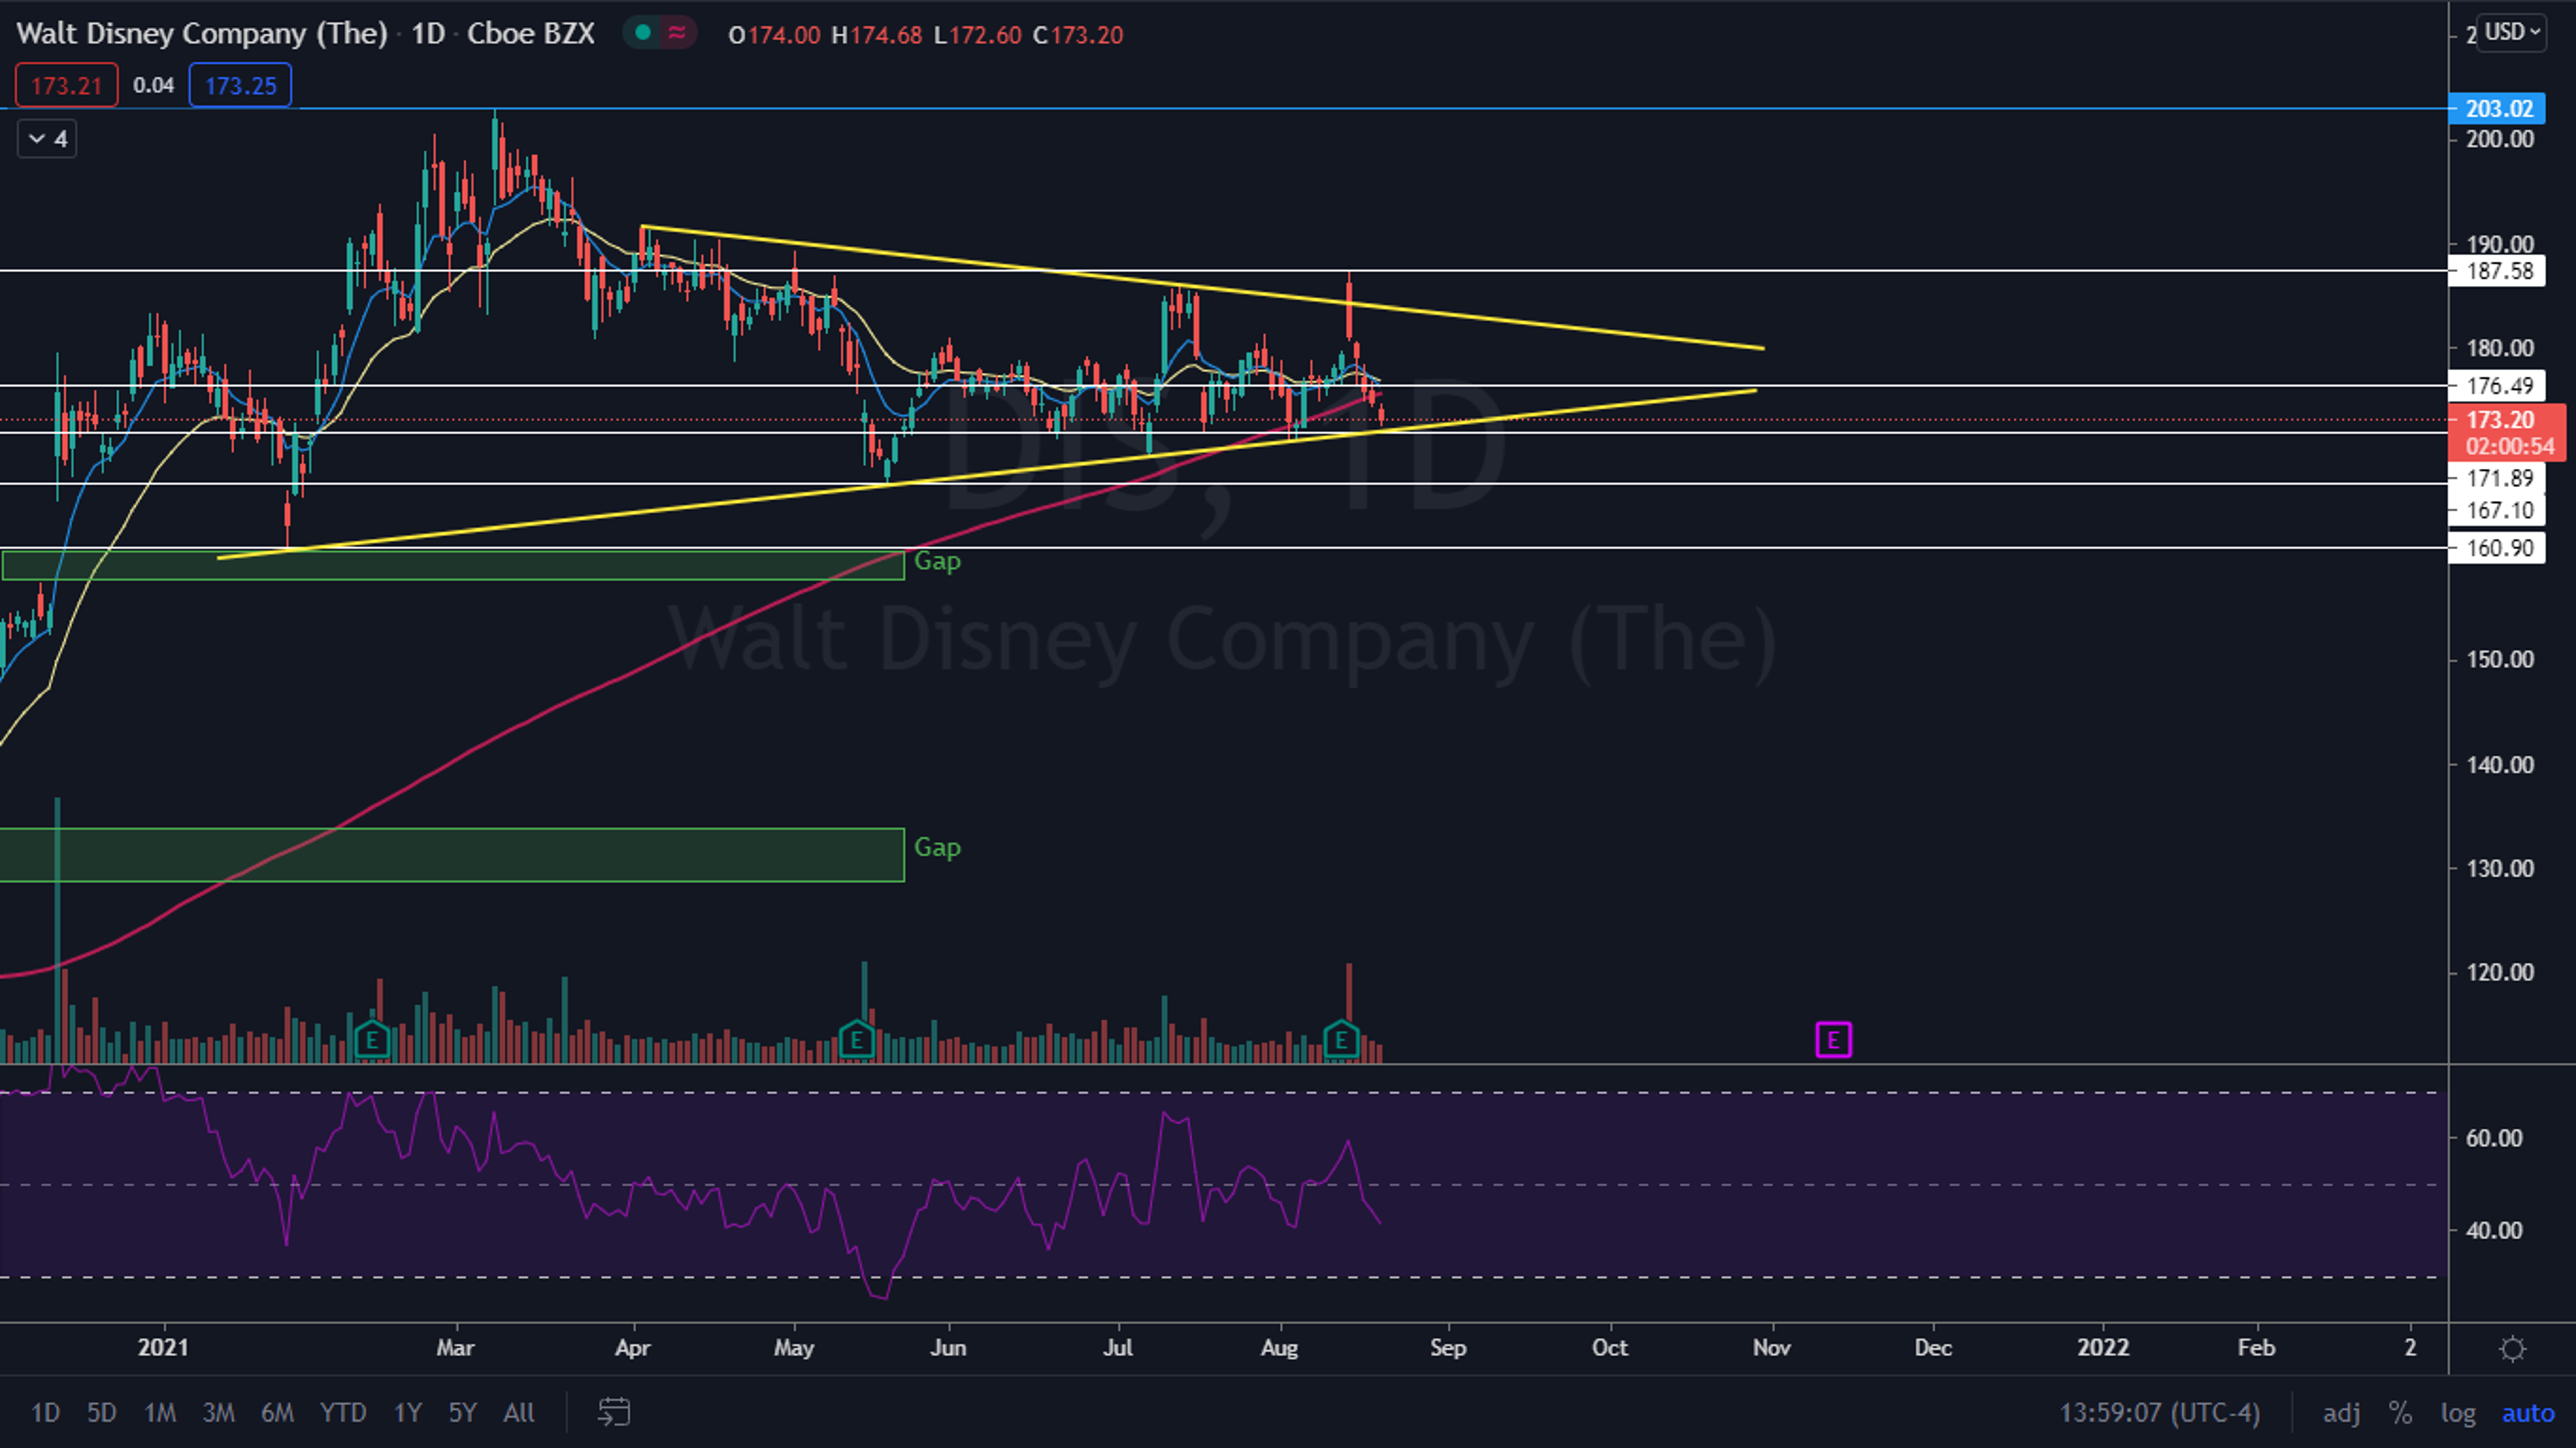
The Disney Chart: Disney’s stock has been trading in a symmetrical triangle since April 5. On Aug. 13, the stock attempted to break up bullishly from the triangle but ran into a group of sellers at a resistance level near the $187 mark and closed the day back down under the upper descending trendline of the pattern. On Thursday Disney’s stock tested support at the ascending trendline of the triangle and held above it indicating the pattern is recognized.
If Disney closes the trading day near the $174 level, it will print a doji candlestick on the daily chart. When a doji candle is printed at the bottom of a downtrend it often signals a reversal to the upside is in the cards.
Disney is trading below the eight-day and 21-day exponential moving averages (EMAs) with the eight-day EMA trending below the 21-day, both of which are bearish indicators. The stock is also trading below the 200-day simple moving average (SMA), which indicates overall sentiment in the stock is bearish.
- Bulls want Disney continue to hold above the ascending trendline and for big bullish volume to come in and push the stock up toward the upper trendline of the pattern. If the stock can break up bullishly from the pattern, it has room to move back up toward $187.
- Bears want to see big bearish volume drop Disney’s stock down from the pattern. If the stock loses the level as support it could fall toward $171.

The Netflix Chart: Netflix had been trading in a sideways pattern between about $505 and $527 since July 22. On Thursday the stock opened slightly higher and big bullish volume came in and drove the stock up through two resistance levels at $531 and $544 before retracing slightly.
Netflix’s stock may have reacted bullishly to a quadruple bottom pattern it created by bouncing up from the $505 level on July 21, 23, Aug. 3 and Aug. 12.
Bullish traders should be aware Netflix’s 4% move higher on Thursday stretched its relative strength index up to about 67%. If its RSI surpasses the 70% level, selling pressure may come into Netflix. This happened three times in July and on July 15 Netflix entered for four days which dropped its price down about 9% and its RSI to the 40% level.
Netflix is trading above both the eight-day and 21-day EMAs with the eight-day EMA trending above the 21-day, both of which are bullish indicators. The stock is also trading above the 200-day simple moving average.
- Bulls want to see Netflix hold above support at $531 and enter into a period of consolidation to garner the strength for another move north which would cool its RSI. If the stock consolidates near the $544 level, it could push up toward $557.
- Bears want to see big bearish volume come in and drop Netflix down below $531. If the stock loses the level as support it could revisit the $520 area.

See Also: Thinking About Buying Stock In Roku, Bloom Energy Or First Solar?
The Roku Chart: Roku has been trading down in a falling channel since July 27, making consistent lower highs and lower lows. The downtrend may be a result of Roku creating a bearish quadruple top pattern at its all-time high near $486.
Roku’s RSI dropped to the 30% level, which almost puts the stock into oversold territory. When Roku’s RSI hit the same level on May 6 the stock rebounded over 30% over the course of the following 12 trading days.
On Thursday Roku was working on printing a bullish inverted hammer candlestick pattern. This will need to be confirmed by Friday’s candle, but indicates the downtrend may be over.
Roku below all three commonly used moving averages, which is bearish. It should be noted that Roku could easily regain support of the 200-day SMA because it is trading only about 4% below it.
- Bulls want to see big bullish volume come in and drive Roku up through the top of the descending channel, which would allow it to regain the 200-day as support. If Roku can trade back above the level, it has room to move up toward the $363 mark.
- Bears want to see Roku’s stock continue to trade down in the channel until it loses support at the $336 level. Below the level Roku has another support at $311.

© 2024 Benzinga.com. Benzinga does not provide investment advice. All rights reserved.
Trade confidently with insights and alerts from analyst ratings, free reports and breaking news that affects the stocks you care about.

