


In light of the S&P 500's tight trading range, the index has traded between 254-266 for 13 straight trading days, there are stocks that are making strong moves. Here are five stocks to watch this week according to VantagePoint, a platform that uses artificial intelligence and Intermarket analysis to predict price movement.
What's On The Charts
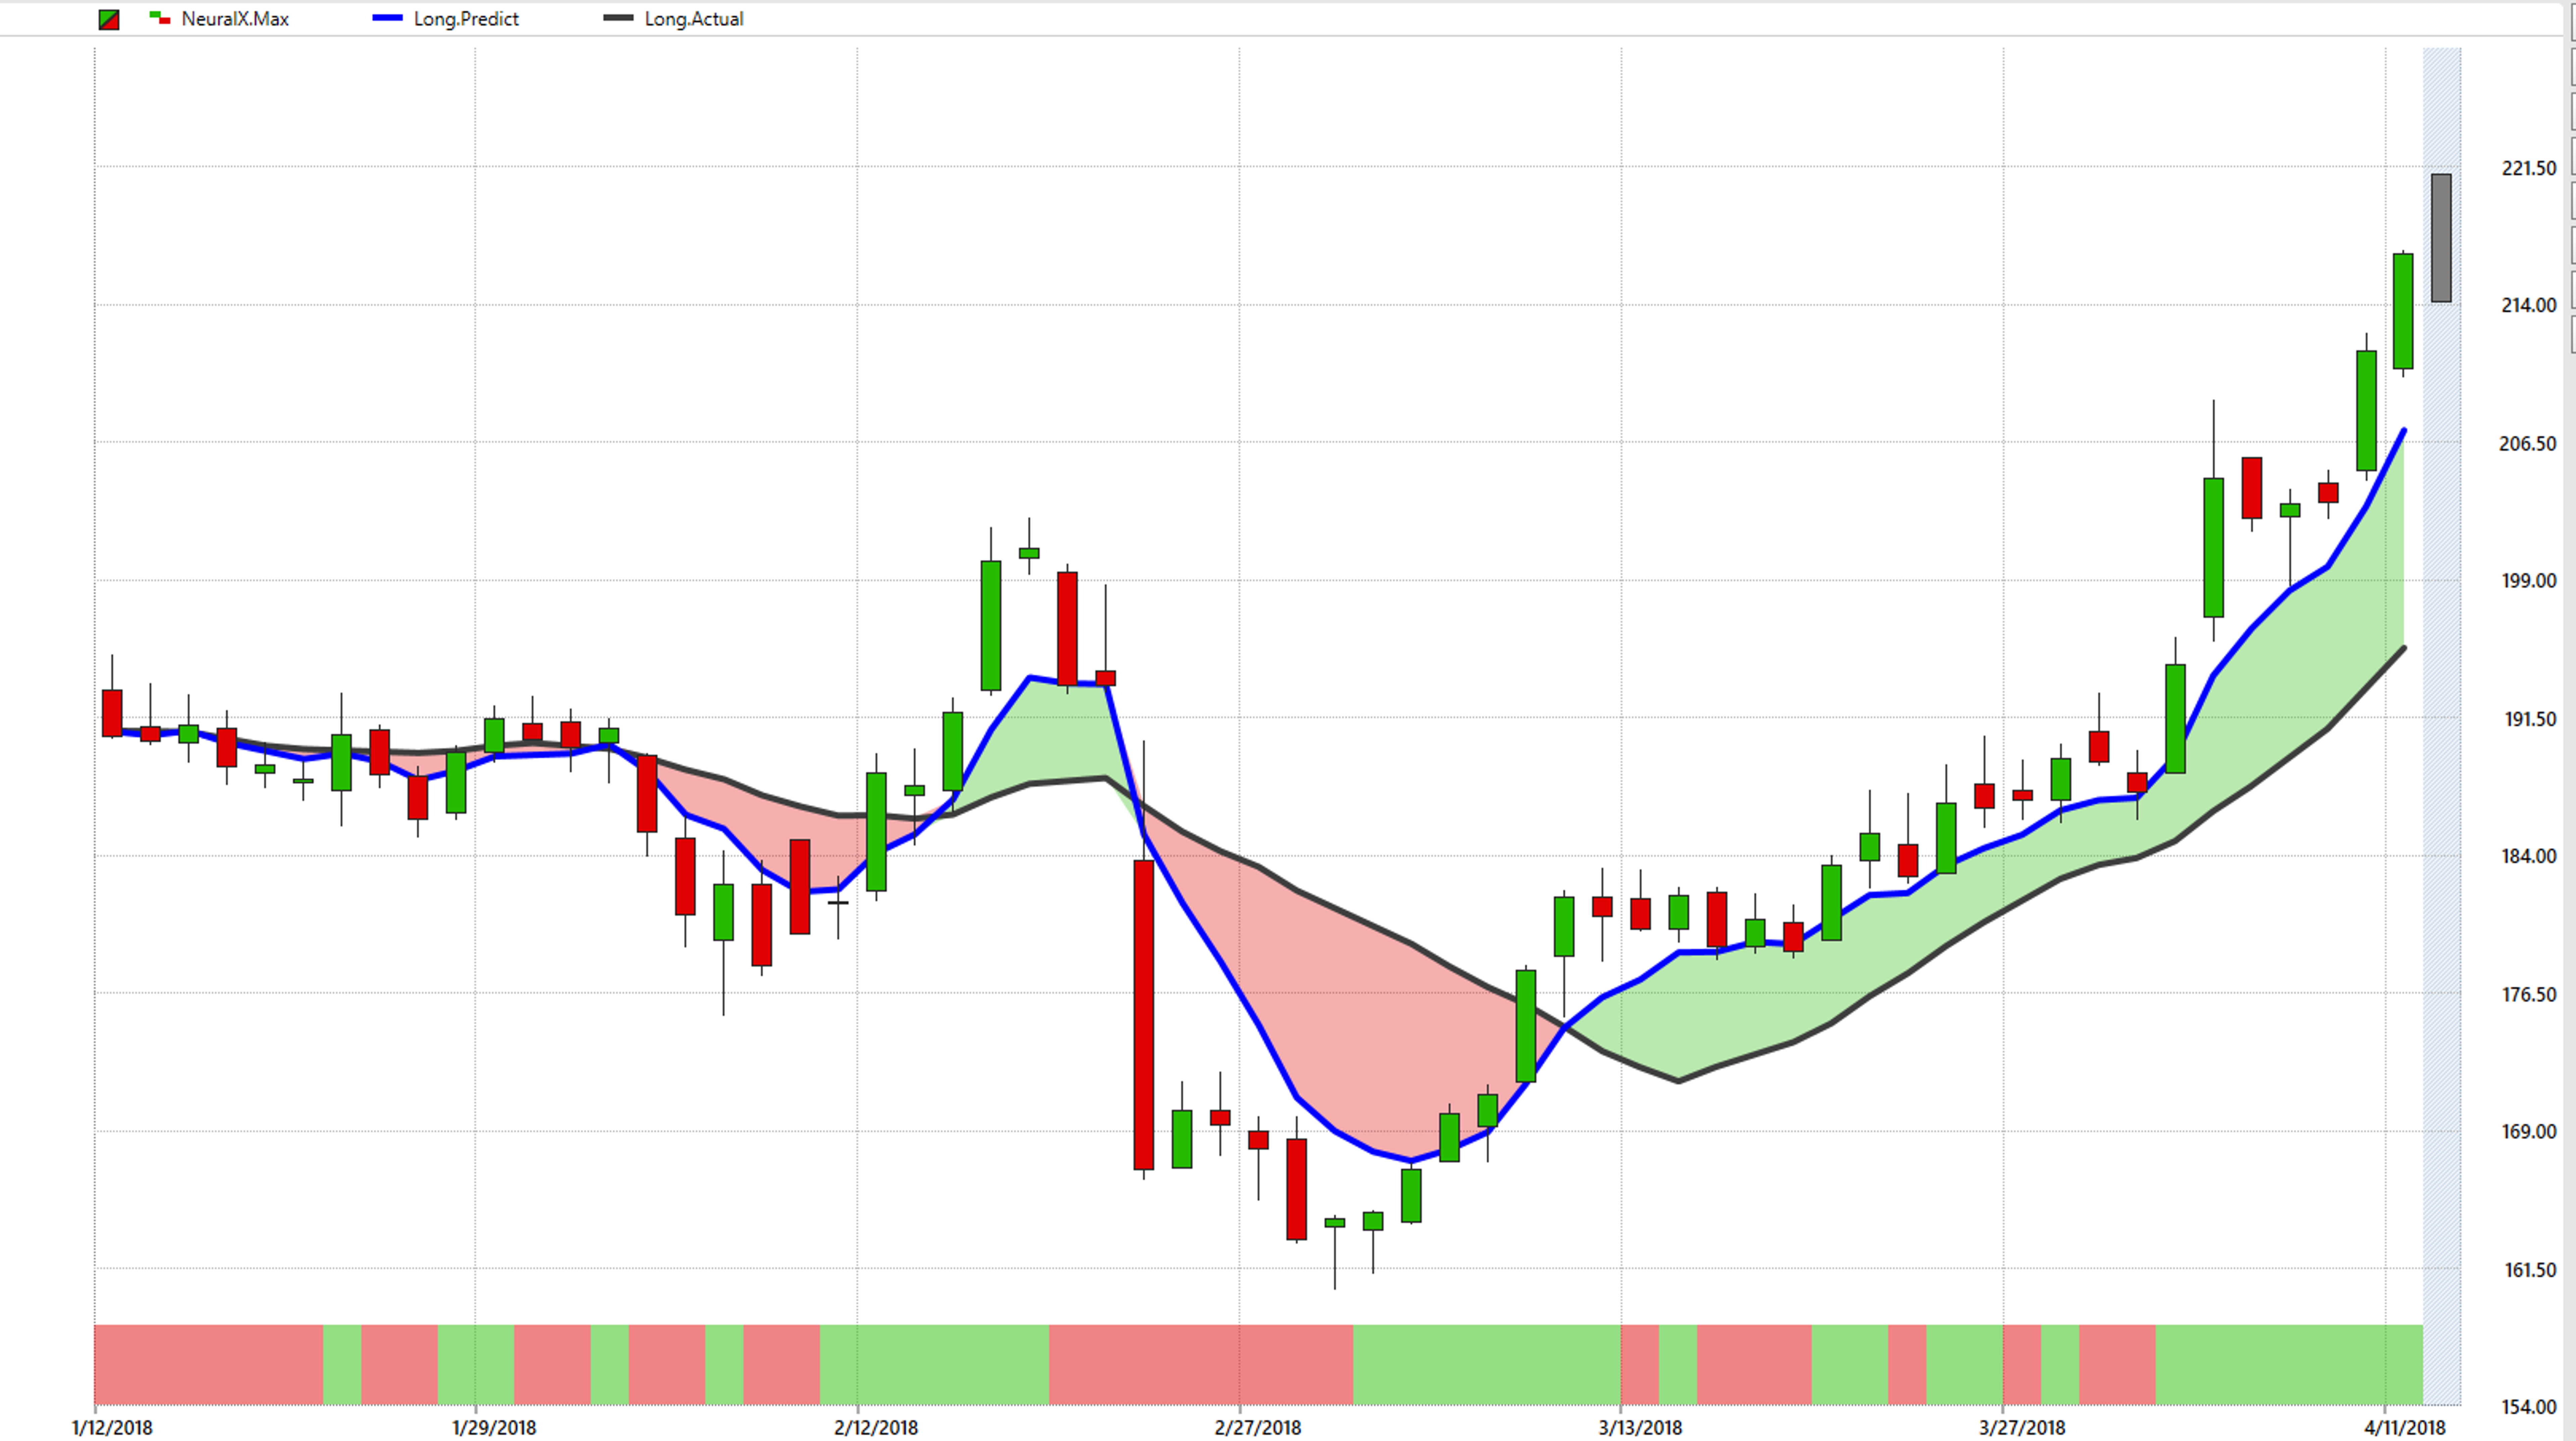
- Each candle on the following stock charts represents one day of trading action.
- The black line on the chart is a simple 10-day moving average.
- The blue line is generated via the AI in VantagePoint's intermarket analysis. It forecasts what the moving average will be 48 hours in advance.
- As you can probably tell, shaded areas of the candle chart represent whether the stock is in an uptrend or downtrend.
A trend shift is represented by the two lines crossing. As long as the two lines don't cross, the current trend remains intact.
- The red/green bar below the candle chart is a Neural Index. It determines whether a stock will move higher or lower in the coming two days.
Stocks To Watch
American Power Looks Like It's Breaking Down
American Electric Power Company Inc AEP has been in a solid uptrend since making new lows on Feb. 8. But it appears that trend has come to an end, as three of the last four days have been down days. The one-month chart below shows that a downtrend has formed, which we can see by a crossover of the two moving averages. In the two-day predicted moving average (blue line) crossed below over the simple 10-day moving average (black line). On top of that, we've got a Neural Index that has shifted to red, indicating near-term bearishness.


Allegheny Technologies Is Breaking out
Allegheny Technologies Incorporated ATI on the other hand, looks like it's on the verge of a breakout. The three-month chart below shows how ATI has turned positive on April 9. That crossover, confirmed by the Neural Index's shift to green, indicates the stock is in a clear bullish trend for now.


Boston Beer Is In Full Rally Mode
Boston Beer Company Inc SAM has taken off like a rocket ship since the beginning of March, and the stock shows no sign of slowing down. As you can see in the three-month chart below, the two moving average lines have only diverged since initially crossing over in early March. That tells us that this trend is fully intact and only getting stronger.

Marvell Has Entered An Uptrend
2018 has not been kind to Marvell Technology Group Ltd. MRVL, but the tide appears to be turning. On Wednesday the 3-day predicted moving average finally crossed over the 10-day moving average. Thursday's positive price action only confirms this trend shift, but this will be one to keep an eye on going forward to see if the crossover sustains itself.


NextEra Energy Is Going The Other Way
NextEra Energy Inc NEE has a similar story to Marvell, but in the other direction. The one-month chart below shows that three days ago the predicted two-day moving average crossed below the 10-day moving average. With the Neural Index firmly red for five straight trading days, this stock looks like one that could be in for more downside.


About the Hot Stocks Outlook
The Hot Stocks Outlook is a weekly series. It’s designed to show traders how improving their timing is the key to maximizing gains and minimizing losses. VantagePoint Trading Software identifies trend reversals with up to 86 percent accuracy, helping traders get into the right side of trades at just the right time.
VantagePoint is an editorial partner of Benzinga. For a free demo click here.
© 2024 Benzinga.com. Benzinga does not provide investment advice. All rights reserved.
Trade confidently with insights and alerts from analyst ratings, free reports and breaking news that affects the stocks you care about.

