


Benzinga’s Securities Lending Volatility Index (SLVX), powered by Tidal Markets, is an indicator that forecasts stock market activity for broad indices and individual securities.
To demonstrate the use of the SLVX as a stock market indicator, take a look at the correlation between SLVX and a -25.65 percent decline in Tilly’s Inc. TLYS over 12 trading days throughout the months of May and June 2019.
Tilly’s Inc. retails casual apparel, footwear, and accessories for young men and women as well as boys and girls in the United States. Its apparel merchandise includes tops, outerwear, bottoms, and dresses while its accessories merchandise comprises backpacks, hats, sunglasses, headphones, handbags, watches, jewelry, and others.
Until May 2019, the year-to-date performance of TLYS was relatively stable, fluctuating between $10 and $12 per share. The stock experienced modest share price spikes in the early weeks of February and the latter half of April. The stock was on the radar for analysts anticipating their upcoming first-quarter earnings call on May 29th.
Entering the first half of May, SLVX values of TLYS were relatively muted, with volatility levels 30 bps below their first-quarter average of $3.40. However, the SLVX spiked over 288 percents as TLYS’ earnings announcement approached, signifying a decline in price was likely imminent.
On the beginning day of our analysis, May 21, 2019, the SLVX reflected a volatility rate of 1.654. As TLYS began to descend in price, the SLVX jumped to 6.955 on May 24th.
|
Date |
TLYS |
SLVX |
|
5/21/2019 |
$ 10.84 |
1.654 |
|
5/22/2019 |
$ 10.64 |
2.591 |
|
5/23/2019 |
$ 10.45 |
1.711 |
|
5/24/2019 |
$ 10.51 |
6.695 |
|
5/28/2019 |
$ 10.27 |
6.119 |
|
5/29/2019 |
$ 10.13 |
6.920 |
|
5/30/2019 |
$ 8.32 |
8.928 |
|
5/31/2019 |
$ 7.80 |
9.040 |
|
6/3/2019 |
$ 7.91 |
6.287 |
|
6/4/2019 |
$ 8.09 |
6.005 |
|
6/5/2019 |
$ 8.05 |
4.665 |
|
6/6/2019 |
$ 8.06 |
4.309 |
Figure 1
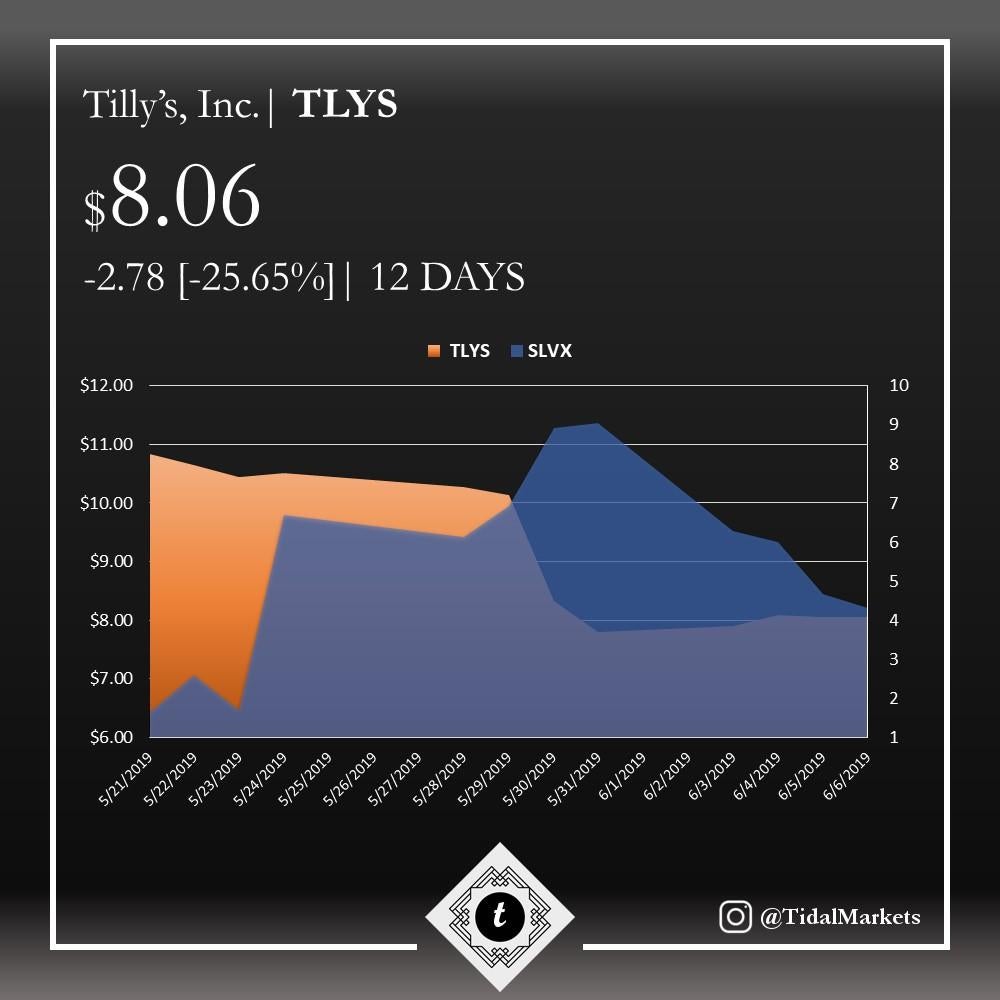
Figure 2
Between May 21st and June 6th, 2019, TLYS fell by -25.65 percent—$2.78 per share—over a twelve-day stretch. Meanwhile, the SLVX saw the volatility of TLYS rally over 288 percent to levels over 9 before falling in volatility as the share price of TLYS quickly descended and plateaued off.
SLVX volatility values of TLYS have stabilized into the beginning of June. Unless Tilly's SLVX of rises again, be on the lookout for a potential buy-back opportunity.
© 2024 Benzinga.com. Benzinga does not provide investment advice. All rights reserved.
Trade confidently with insights and alerts from analyst ratings, free reports and breaking news that affects the stocks you care about.

